Imagine you’re a detective trying to identify criminals in a crowded room. Some are guilty, and some are innocent. Your job is to catch the bad guys without wrongly accusing the good ones. This scenario is surprisingly similar to how physiotherapists use diagnostic tests to identify injuries or diseases. But instead of handcuffs and magnifying glasses, we rely on concepts like sensitivity, specificity, and likelihood ratios. These terms might sound intimidating, but once you understand the basics of Bayesian statistics, they become powerful tools for making better clinical decisions.
Let’s break it down with a detective analogy and some practical examples.
The Detective Analogy
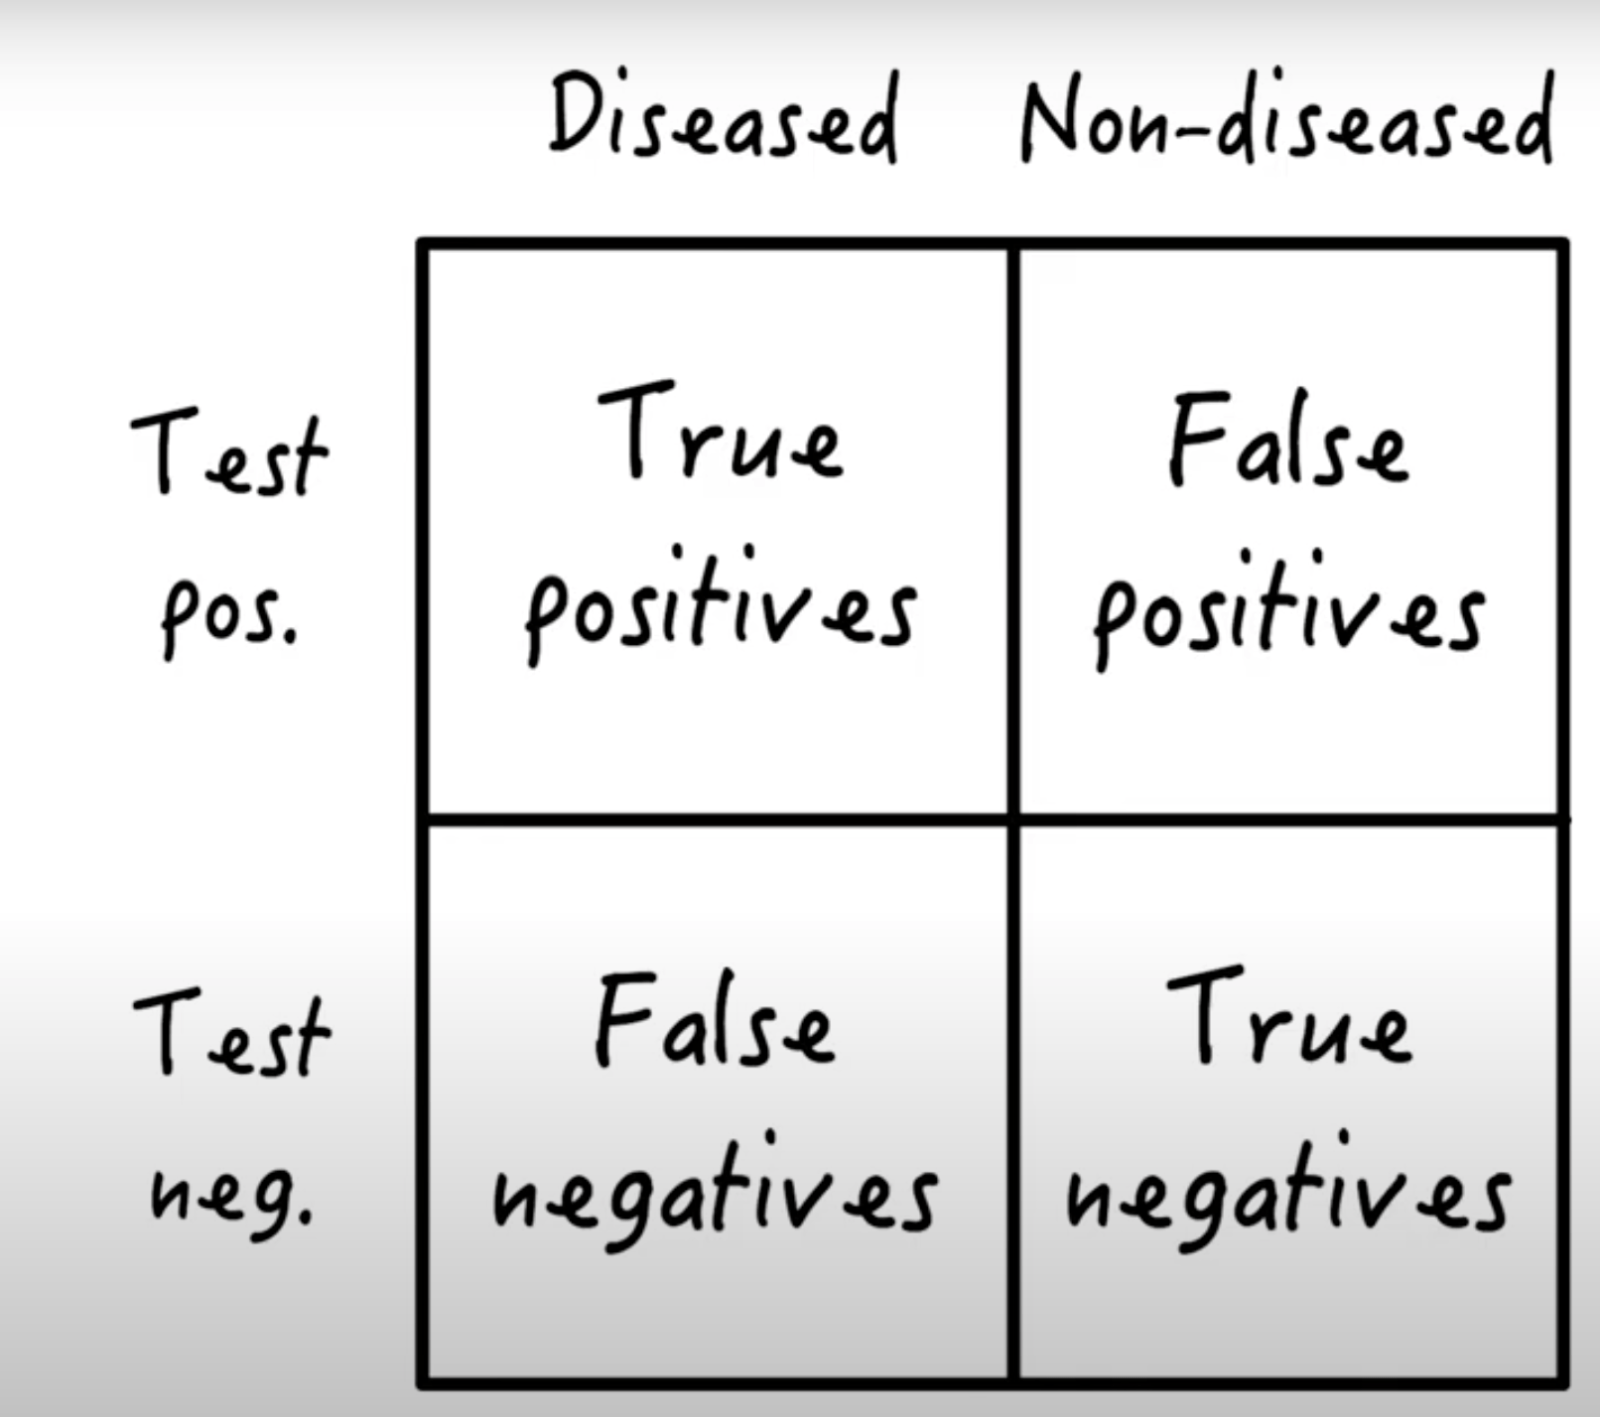
Sensitivity: This is your ability to correctly identify the bad guys (patients with the injury or disease). A highly sensitive test means you’re catching most of the criminals. Can be expressed as probability (e.g. 0.95) or as percent (95%)
False Negatives (1−Sensitivity): These are the bad guys who slip through your net.
Specificity: This is your ability to avoid falsely accusing the good guys (healthy patients or those with a different injury). A highly specific test means you’re not pointing finger at innocent people.
False Positives (1−Specificity): These are the good guys mistakenly labeled as criminals.
While sensitivity and specificity are important, they don’t tell the whole story. To truly refine your detective work, you need two more tools: Likelihood Ratios and Prior Probability.
Making Test Results Practical
Likelihood Ratios help you understand how much a test result changes the probability of a diagnosis. Think of them as magnifying glasses that sharpen your focus.
Positive Likelihood Ratio (PLR): How much a positive test increases the likelihood of a disease. This is ratio of true positive to false positive.
Formula: Sensitivity ÷ (1−Specificity)
A high PLR means the test is great at confirming a diagnosis.
Negative Likelihood Ratio (NLR): How much a negative test decreases the likelihood of a disease. It is based on ratio of false negative to true negative.
Formula: (1−Sensitivity) ÷ Specificity
A low NLR means the test is excellent at ruling out a diagnosis.
These ratios adjust your Prior Probability—your initial belief about the likelihood of an injury or disease before testing. Prior probability can come from:
Prevalence data: How common the injury is in similar patients.
Clinical judgment: Your experience and the patient’s symptoms.
Uninformed estimates: When you have no strong prior belief (e.g., evenly splitting probabilities between possible diagnoses).
Practical Example: Diagnosing a Shoulder Injury
Let’s say an athlete comes to you with shoulder pain, and you suspect a SLAP lesion (a type of shoulder injury). According to research by Behnam Liaghat and colleagues, the prevalence (prior probability) of SLAP lesions in similar cases is 30.7%, or odds of 0.44 (30.7 ÷ 69.3).
You decide to use the Biceps Load II Test, which has:
Positive Likelihood Ratio (PLR): 26.38 (very strong)
Negative Likelihood Ratio (NLR): 0.11 (quite good)
If the test is positive:
Multiply the prior odds by the PLR: 0.44 × 26.38 = 11.6
Convert the new odds to a percentage: 11.6 ÷ (1 + 11.6) = 92%
Conclusion: There’s a 92% chance the athlete has a SLAP lesion.
If the test is negative:
Multiply the prior odds by the NLR: 0.44 × 0.11 = 0.05
Convert the new odds to a percentage: 0.05 ÷ (1 + 0.05) = 5%
Conclusion: Most likely you can rule out a SLAP lesion.
What if you use multiple tests? You can multiply the prior probability by the likelihood ratio for each test, refining your diagnosis after each test.
Another Example: Groin Injury and Rectus Femoris Involvement
Let’s say a football player comes in with an acute groin injury. Initially, you don’t strongly suspect the Rectus Femoris (RF) muscle is involved. But then the player mentions the injury happened while kicking a ball, which increases the likelihood of RF involvement. You perform the Thomas Test RF stretch, and it reproduces the player’s symptoms.
Here’s how Bayesian reasoning helps you quantify this (all numbers are based on studies of Andreas Serner et al.):
Initial belief: 13% of acute groin injuries involve the RF.
After learning the injury occurred during kicking: The probability rises to 28% (odds 28:72) .
After a positive Thomas Test RF stretch (PLR 5.47):
Multiply the odds (28 ÷ 72) by the PLR of (5.47): (28 ÷ 72) × 5.47 = 2.13
Convert to a percentage: 2.13 ÷ (1 + 2.13) = 68%
Conclusion: There’s now a 68% chance the RF is involved.
This step-by-step updating of probabilities is Bayesian reasoning in action—a logical, structured way to refine your diagnosis based on new information.
Why Bayesian Statistics Matters
Many physiotherapists find Bayesian statistics intimidating, but the truth is, you might already be using it without realising it. Every time you update your diagnosis based on new test results or patient history, you’re applying Bayesian principles. It’s not about complex math—it’s about thinking logically and systematically.
By understanding sensitivity, specificity, likelihood ratios, and prior probability, you can make more informed decisions and provide better care for your patients.
Summary
Bayesian statistics isn’t just for mathematicians—it’s a practical tool for clinicians. It helps you quantify uncertainty, update your beliefs, and make smarter diagnostic decisions. So the next time you’re faced with a tricky case, channel your inner detective and let Bayesian reasoning guide you.
For a deeper dive into Bayesian statistics for medical tests, check out this excellent explanation: